Data Visualization
Discover valuable, data-driven insights
Data Visualization
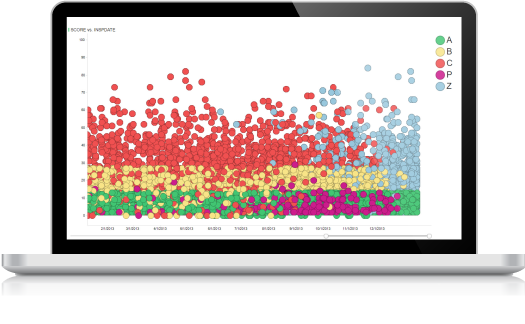
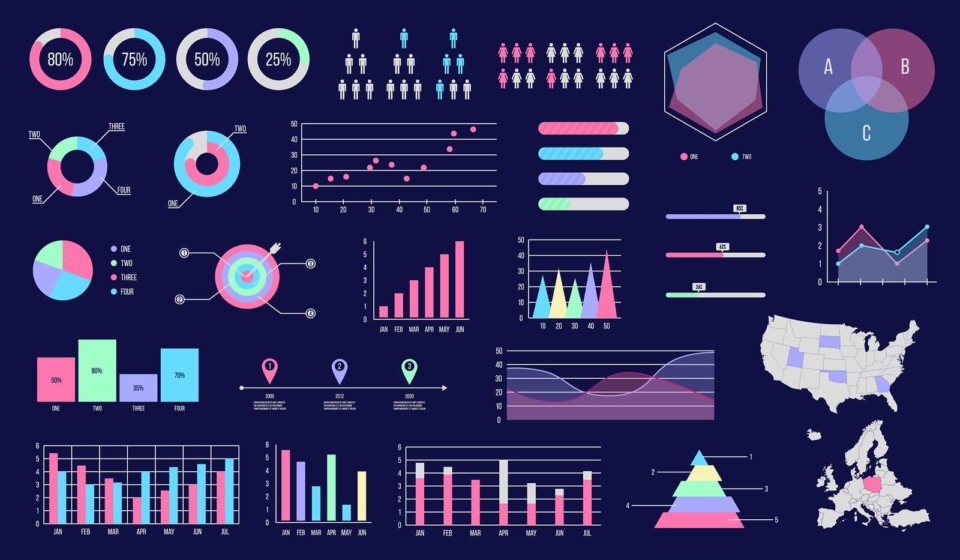
We cover a wide range of service areas for Data visualization from upgrading the existing excel system to develop the whole data mechanism for visualization. We believe that data visualization is a way forward to take your business to new heights by providing data analytics in the form of trends, categories, brands, etc. We develop strategies that help our clients to get deep insight from their data and keep them update about market trends. This practice helps us to develop key performance indicators. Our main priority is to ensure that our clients get maximum insight from their data so we work with custom dashboards to report system.
Our Data Visualization Services
- Dashboard Development
- Data Modeling & Data Discovery
- Technical installation, upgrades, security & confirguration
- Enterprise Reporting
- Mobile Solutions
- Staffing Services & Training
- Support & Maintenance


How Do We Do It?
Step 1- DATA INTEGRATION
- We provide integration with leading data analytical tools like CSV, SQL, Oracle, etc.
- Extracting the data from these sources and using it for business analytics through data visualization.
Step 2- DATA TRANSFORMATION
- We start by modeling the data for better understanding.
- Data is aligned by performing ELT operations.
- Raw Data is cleaned by removing inconsistencies.
Data is structured properly.
Step 3- DATA VISUALIZATION
- Data is visualized on leading tools like Spotfire & Tableau.
- Customized & interactive dashboards are created.
- Live data streaming.
INDUSTRY INSIGHT:
Our main goals is to provide you services that will help you in development of a successful business. We provide you with techniques and strategies that will give you deep insight to your data and market trends.
In other words great data visualization that will ensure the right decisions based on data thus, great results will be waiting for the business. High quality Data visualization Provide business employees with the right insight and tools to comprehensive data in time.
Data Visualization Tools We Work With:
GCE Team has expert Data Scientists having skills in a variety of technologies & tools. Based on your business nature and needs we will work the tools that suit you best.

Spotfire
Spotfire is one of the top tools for automated data flows covering all sources, analytical dashboards and Sate visualization. This works as a catalyst to make in time data results.

Tableau
Tableau is a very powerful Data Visualization tool used in the Business Intelligence Industry. It can produce the data insight reports that put light on the operation condition in the real-time.
